Today, In maths class the topic my class and I studied was Statistics. I was able to gain more knowledge on how to describe and analyze the scatter plots on a graph, this helped me identify the meaning of Bivariate data, which is the analysis of two variables. In class one of the tasks, we were given was to identify, analyze and compare the weight and circumference of apples in a supermarket. The idea of this task was to help us students describe, analyze, and compare the data of two variables.
During this topic, I learned about the meaning of TASU (Trend, Association, Scatter, Unusual points), and how to identify TASU in a scatter graph. This was a fun and exciting topic because I was able to learn new things.
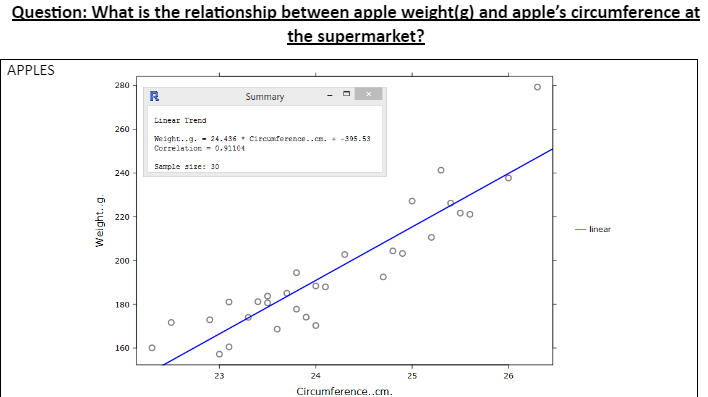
The weight of apples in a supermarket and the circumference of the apple. There is a strong, positive, linear relationship between the Circumference of apples and the Weight of apples in a supermarket. Therefore, as the Circumference increases the weight of apples also Increase.
0 comments:
Post a Comment